Tag Archives: modeling

Modeling Thermo

In applying the modeling methodology to IBDP physics, there are a few gaps. In this post, I present a unit that uses the modeling approach for the thermal physics and thermodynamics unit of Physics.

1. Building background

Have students touch something warm and sonething cold. Ask what is happening in terms of energy in these interactions. There are two main goals for this short preliminary discussion:

a. definitions of the terms heat and internal energy
b. an agreement that heat, as a transfer of energy, is sufficient to explain thermal processes, and is what we feel

2. Paradigm Lab I

For this lab, masses of hot and cold water are mixed in an insulated cup. After a demonstration of the effect, students should walk through a variable brainstorming session (I like a version I learned from Karl Schmidt that has three steps: observations, measure-ables, manipulate-ables). The students should recognize that either the hot water mass or the cold water mass could serve as the independent variable. They will recognize that the temperatures are dependent, but might need some help to decide to use the ratio of temperature changes as the dependent variable.

The students will thus conduct two labs, perhaps by splitting into two groups and sharing in the whiteboard meeting. They should find that the ratio of temperature changes is proportional to one of the masses and inversely proportional to the other. Be careful to define the ratio of temperature changes clearly for everyone before beginning data collection.

Combining results and looking at slopes allows us to construct the equation:

mass of hot water * temperature change for hot water = mass of cokd water * temperature change for cold water

Now, the students should recognize that this reflects the heat flow discussed earlier, but since heat is n energy change the units don’t work out and we need to have a coefficient. Students should think about what this coefficient means (it is the energy released/absorbed to change the temperature by one degree Celcius for each kilogram of matter).

3. Some practice with calorimetry problems without phase changes here. I spontaneously put two on the board at the front, and had student pairs write a third.

4. Demonstrate a melting curve. This may be difficult, but at least set up the apparatus and sketch the resulting curve.

First provide students with the power output of the heater and the mass of your sample and ask them to find the specific heat capacity of the sample (ie: using the slope).

Next, point to a segment where the temperature is unchanging and ask students to try to explain what is happening here. Socratic questioning and your favourite applet (PhET, etc) is good here. There are lots of misconceptions here, so insist on very clear statements and model IB language (ie: from past exams).

Students can usually guess the form of the latent heat equation (Q=mL), so I ask them how they would design an experiment to test that, and then we move on.

5. Model deployment, proper.

Now, the students are ready for some lengthier calorimetry problems, so they do a worksheet of these.

6. Quiz

A quiz based on the worksheet.

7. Practical I

I do a calorimetry problem at the front of the room, moving a hidden mass of steel from a hot water bath to a known mass of cold water. I provide the temperatures and the students predict the mass, which we put on a balance once all the predictions are in.

8. Paradigm Lab II

This could be done using a PhET simulation, or with an apparatus like the one shown below (the block could be replaced with a heating element to manipulate the temperature, and a pressure sensor should be attached to the flask somewhere):

4_9fig

Image from Purdue University (http://chemed.chem.purdue.edu/)

Briefly outline the nature of an ideal gas (no potential energy, elastic collisions providing pressure, etc). In the regular pre-lab process, students should identify pressure, volume, temperature, and number of molecules (or mols) as the relevant variables. For now, leave the number of moles aside (ie: keep the device closed): this leaves three experiments, all of which should be done:

  1. How does a changing temperature affect the pressure at constant volume?
  2. How does a changing temperature affect the volume, when the volume is adjusted (ie: by extending the syringe) so that the pressure is constant?
  3. How a changing volume affect the pressure at constant temperature? (this works better by connecting the syringe directly to the pressure sensor)

Connecting these gives that PV/T = constant. Logically, P and V should be proportional to the number of moles n, while T is inversely proportional to n (at constant P and V), so this becomes PV/T = nR, where R is the ideal gas constant.

After rearranging this equation into the familiar form (PV=nRT), as students to determine the units on the left side. This gives the units of R as J/mol/K and, more importantly, shows that the ideal gas law is fundamentally a statement about the amount of internal energy in the gas. A brief note about the Maxwell distribution and rms velocities of the particles is probably appropriate here, even though it does take us out of the modeling cycle.

9. Deployment II

Now, the students do a second worksheet, on the ideal gas law. This also includes the three constituent laws (Boyle’s, Charles’, and the Gay-Lussac/Amonton) and practice with the exam-style question “determine whether this graph shows that the gas obeys Boyle’s Law (etc)” by checking points on the graph to determine whether the relationship is proportional, inverse, or otherwise.

10. Practical II

CTdr6D6UYAEGFKT

11. Unit Test


PE Effect Lab

I tried to use the photoelectric effect as a paradigm lab for our unit on atomic, nuclear, and particle physics. Ultimately, it was a failure. This post will do two things: (a) explain how to create and use apparatus to make this lab work, and (b) analyze why it didn’t work for me.

Two sources need to be acknowledged first. As always, Arons did a fantastic job of explaining why the photoelectric effect is difficult for students, and he also provides a good plan if you wish to introduce it. Secondly, the design of my apparatus was inspired by one designed by Rice, Garver, and Schober.

Background

The photoelectric effect is a simple idea with devastating consequences. Essentially, light shining on a metal causes electrons to be knocked off the surface of the metal. If two electrodes are placed close together and connected with a metal wire, these electrons cause a current to flow in the wire, which can be detected with a microammeter.

Thus, we should be able to detect the photoelectric effect with just four pieces of equipment: a pair of closely-spaced electrodes, a microammeter, some wire to connect them, and a light source.

20150826_172055

The first of these is the toughest: the electrodes should be in a vacuum, so the electrons are not absorbed or scattered by air molecules. The 1P39 vacuum tube is perfect. There are usually a few such “new old stock” on ebay, at a price of about USD 40 each. I’d suggest getting stands for the tubes, too: the part number is 27E122, and the active sockets are 4 and 8.

A decent multimeter can accurately read down to 0.1 microamperes, so that’s no problem. I put little wire loops on my stands so that we can use wires with alligator clips. Ambient light is enough to produce about half a microamp of current.

I demoed this with the students, and they were able to draw the relevant simple circuit diagram and construct their own simple devices pretty easily. I had them spend about 15 minutes investigating the impacts of light intensity and light colour (frequency) on the current. We didn’t spent much time analyzing this, but the results were clear and straightforward: more light means more current, and different colours seemed to have different currents as well, but in a less-obvious way.

Stopping Potential

Okay great, we’ve got light creating electricity. So what? The clever trick is to apply a (variable) potential difference across the electrodes. If you adjust the potential difference so that a large positive charge is on the “receiving” electrode, the electrons will accelerate to that electrode, and the current should increase to a certain saturation point. This is where all the electrons are reaching the “receiving” electrode.

On the other hand, if you reverse the potential difference and apply a negative charge to the “receiving” electrode, the electrons will be repelled. However, at a very low potential, some of the electrons will have enough kinetic energy to overcome the electrostatic repulsion and enter the “receiving” electrode. Thus, the game is to slowly increase the potential until all the electrons are stopped from reaching the receiving electrode.

At this point, the kinetic energy of the electrons is equal to the electric potential energy provided by the potential difference (ie: KE = q * V). Thus, given the charge of the electron, we can use the Stopping Potential to calculate the amount of kinetic energy the electrons have when they exit the metal.

20150826_171828

The range of potentials needed is about 0 to 1.5 V. I used some 10 kOhm potentiometers and 56 kOhm resistors to make potential dividers that would give appropriate voltages from a 9V battery. I like working with 9V batteries, but there’s no reason not to use a AA directly on a potentiometer instead.

When you add the potential difference, you also need a voltmeter and another pair of wires — things start to get a bit messy on the lab table. This was where my students got caught. Although they were able to digest the idea of a stopping potential (with a bit of prompting, the students put together the idea without my help), actually constructing the circuit on the lab bench proved to be too much.

20150821_183422

A few (top) students were able to recall what they knew about voltmeters, and were able to draw appropriate circuit diagrams. Most were not, which means that (a) our study of that topic last year did not have lasting outcomes, and (b) I wasn’t scaffolding the circuit-building well enough.

Worse, though, a design flaw popped up that took me a while to diagnose and repair. If you apply the potential difference to the vacuum tube backwards, and turn the potentiometer, you’ll get a variety of currents. When the potential difference is zero, the current is nearly zero, and when the potential difference is increased, the current increases as well. To the students, this behaviour didn’t seem abnormal. Thus, I had to check with the groups one at a time, check that they’d wired up correctly, and do a bunch of plugging/unplugging if they had it backwards. Murphy’s Law stepped in here, and so I ended up spending a couple minutes fixing all of the apparatuses before we could even begin experimenting.

I ought, thus, to have labelled the tube stands with + and – signs, and asked students to ensure they were connecting things correctly.

By this point, of course, the lab had come off the rails. The experiment was no longer theirs, and after asking the students to sit patiently for about 20 minutes while I troubleshot their circuits, behaviour issues were cropping up too.

Frequencies

The goal of the lab is to get a graph of electron energy (ie: 1.6e-19 C times the stopping potential) over the frequency of light that is causing the photoelectric effect. This graph will have a negative vertical axis intercept representing the work function of the metal (ie: the amount of energy required to liberate the valence electron) and a slope representing the amount of energy a quantum of light will have, for each Hz of frequency (ie: Planck’s constant).

LEDs work quite well for this, since they emit a fairly narrow range of wavelengths. I made some multi-LED sources using surface-mount super-bright LEDs. I first laid down some adhesive copper tape, then super-glued the LEDs in place. Soldering wasn’t too bad, but problematically the plastic base started to melt if I wasn’t really quick with the soldering gun. A 6-position rotary switch allowed the students to choose between LEDs, and I used 5V wall-wart adapters for this (my love affair with 9V batteries aside, I really don’t like using batteries in the lab).

20150826_171527

Easier is to get a selection of through-hole LEDs and 3V coin-size batteries. You can hold the battery between the leads of the LED and make a complete circuit by holding the LED leads against the battery faces with thumb and forefinger.

I had some blue and near-UV LEDs that my students used in this manner, and they didn’t have much trouble with it. I’d suggest making a small hole in the side of a cardboard box for this approach. The cardboard box covers the vacuum tube, blocking out stray light.


The weakest students had trouble figuring out the frequencies of light from the wavelengths, so I sat down with the worst offender and we worked it out; I asked him to write his answers on the whiteboard at the front.

Putting It Together

We had some trouble with LoggerPro. The students typed in their numbers in the format 1.3*10^(-19), but LoggerPro interpreted those as text labels rather than numbers. Worse, when they tried to correct the problem, by typing 1.3e-19, the cell was replaced with 0. Surely that cannot be correct! (It is.) I did a second tour of the room, showing each group about this strange notation, and the strange behaviour from LoggerPro.

At this point, it became clear that a lot of the groups had been quite careless with their data collection. Their points had a lot of scatter, and some had points that couldn’t have been correct. I noticed two differences between how I conducted the experiment, and how they did:

  1. I was careful to zero out the current with the light source off, then turn the LED on, and only then begin to increase the potential difference. The students usually didn’t check their light shields, and didn’t return the potential difference to zero between trials.
  2. I increased the potential difference slowly, carefully, and deliberately. The potentiometers are sensitive enough to get 0.01 V accuracy, which I could justify in my own trials of the experiment, but the students were not careful enough to get consistent and reliable stopping potentials.

We whiteboarded our results. Three groups had unusable data: two because of spurious results, and the third for reasons I cannot fathom but surely related to their being “done” with data collection after about 3 minutes (my suggestion of multiple trials was not adopted — this is probably related to the breakdown of discipline I mentioned earlier). Of the others, all but one made fairly-obvious calculation errors.

The single group with decent data and error-free analysis came up with a result of about 4e-34 J s, which isn’t bad — but not nearly as good as the robust result I was able to get when I did the lab myself, using the same equipment, of 6.3e-34 J s.

Conclusion

Summer rustiness? Surely. A tricky lab that needed more scaffolding and support. Yep. A lab that allowed us to see that E = hf and that light comes in quanta, without needing a teacher to point and explain? Nope.

Overall, my attempt to use this lab as a paradigm to anchor our unit on modern physics was not successful. We spent about 3 hours developing it, and yet came away with only a sketchy model. After our whiteboard session, I needed to decide between two alternatives: re-do the lab, hopefully getting better results and accept a week-long setback, or move on and try to use the Bohr atom as a model instead. There was so much frustration about the lab, and our IB curriculum is so unforgiving, that we could only move on.

This lab could work. It could be really good. It brings together ideas from earlier studies of electricity and waves, and it provides a clear basis for further studies of atomic physics. However, if you decide to use it, go slow, be deliberate, and ensure the students do the same.

Edit: check out the good comment by Andy, below. On Twitter, Frank asks, “Have you tried using the PhET simulation on the photoelectric effect? Could possibly using in tandem with hand-on lab, similar to how folks use the circuit sim in lab.”

Whirly Tube Physics

At a Modeling workshop earlier this summer, I was given a “whirly tube”. When you swing it in a circle, it makes a low-pitched whistling sound. There are overtones as well. It’s a pretty interesting instance of the classic standing wave in a tube scenario.

The product is available from Steve Spangler’s store (click the image above).

I wrote up a bit of a physical exposition of what (I think is) is going on with the whirly tube.
Read the PDF

I’m not convinced this explanation is correct. Andy’s suggestion below seems good. I’d appreciate hearing from anyone with insight.

Energizing PD

I just finished a two-week professional development workshop in California. The workshop left me feeling energized, excited, and ready to get back to the classroom. Here were some of the best things about it:

  1. The instructor, Jon Anderson, was phenomenal. He had lots of experience teaching the wave and light models we worked on, had plenty of demonstrations and practical activities lined up for us, and had a deep understanding of what worked and what didn’t. But, perhaps even better, he ran the workshop as a modeling classroom: learner-focused, no lecturing, and taking the time to talk through everything of interest.
  2. In my group of 15 teacher-learners, we had a spectrum of backgrounds and levels of engagement. Yet everyone pulled in the same direction, everyone contributed, and we taught each other a lot. Jon gave us time to innovate, too, so we came out of the workshop with more individually than we’d walked in with cumulatively (including Jon).
  3. Our discussions usually spilled over into breaks, lunch, and extra-curricular activities. One lunch break, we hopped a fence to test out the feasibility of a swimming pool for showing double source interference patterns. The next day was a heated discussion about colonization of other planets, and the day after that was about Project-Based Learning.
  4. There was a rich assortment of extracurricular activities available, including those organized by the workshop conveners (a bonfire on the beach, watching the world cup at the nearby bar) and those proffered by the local community (farmer’s market, hiking, whale-watching).
  5. The workshop was held at Cal Poly University in the beautiful town of San Luis Obispo. It is a wonderful, sunny, warm, friendly environment, and the facilities of the university (especially their well-stocked physics demo room!) made the two weeks feel both vacation-y and Christmas-y.
  6. The people who organized the workshop, including the folks who run the superb Noyce programme, made it clear that they consider high school physics to be a very high priority. We were feted, no doubt, and it was clear that the instructor was given the funding and supplies needed to do a great job. We were especially lucky to have a local undergraduate student help with the lab supplies — we certainly kept her busy!
  7. The teacher-learners worked together on a shared Google Doc that captures much of the key points, video/pictures of great experiments/demos, good pedagogical ideas, suppliers of useful equipment, and so forth. It is certainly something I will refer back to frequently.
  8. Follow-through. We scheduled monthly online check-in sessions, and everyone seems pretty enthusiastic about them so far. Even when I’ve done good workshops in the past, I haven’t necessarily felt like I would keep in touch with the other participants: here, I certainly want to.

… and that’s what I call good PD.

Electricity Model

We have been building up a few models in relation to electricity, following the IB sequence of charges, electric fields, circuits, and emf. We started with the scotch tape paradigm lab, which I think did a decent job of establishing the ideas of charge and conductors. Given the choice between using pith balls or an online simulation to discover Coulomb’s Law (“You”-lomb’s Law, I insisted; you are the one who found it), most preferred the sim — but both produced data that linearized well to show the inverse-square relationship. This led to a comparison with Newton’s (“You”-ton’s) Law of Gravitation, and the definition of electric field strength. In study halls, I caught up with my HL students and we assembled the machinery of field diagrams and potential, and also went through the argument that E in a conducting sphere should be 0.

image

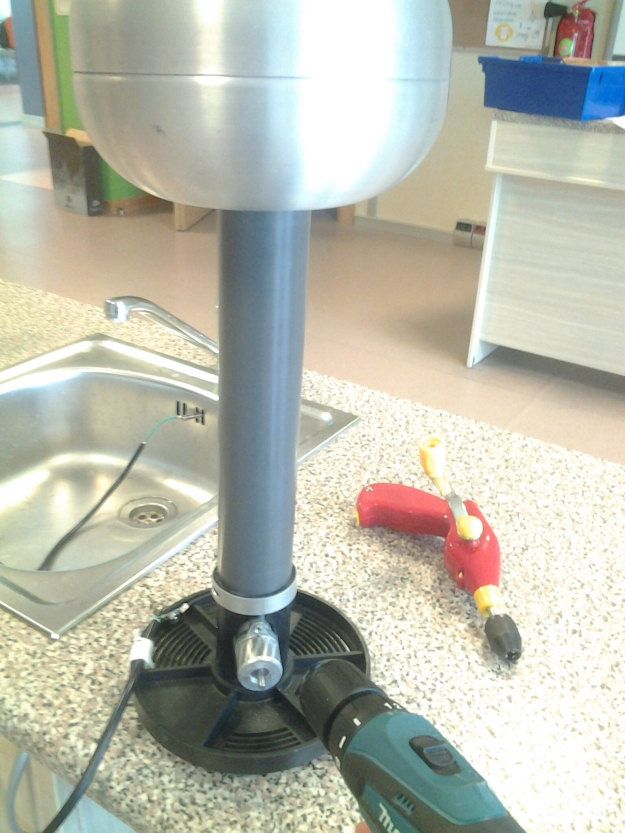
Our van der Graaff generator has been out of service for a couple years, so I stripped out the motor, soldered in a ground wire, and configured the lower roller so it could be driven by a drill. I think this is pedagogically valuable, since it removes the assumption that the static electricity comes from the mains, and allows students to see more easily how the device works. This is the third time this year I have built apparatus around an electric hand drill — it is such a great tool.

image

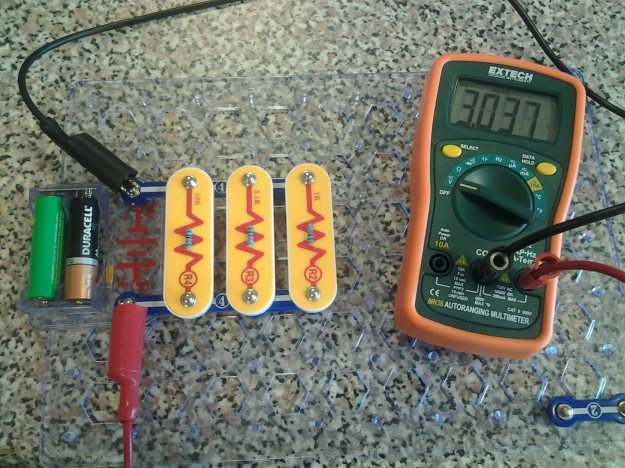
Like Evan Weinberg, I used the PhET circuit builder to give the students some time to conceptualize the circuits before putting their hands on wires. I tried using these snap circuits to build the circuits, and it worked really well. None of the groups had trouble navigating the circuit digram-to-wires gap with the snap circuits, and they had little trouble putting together series and parallel circuits. I had them measure V for the battery, then predict the current using the resistors’ stated values. This worked really well, and their follow-up measurements were a source for smiles. The extrapolation to series circuits was straightforward, but parallel circuits were tougher, and will need more scaffolding. I think this means some group problem-sets tomorrow… with the snap circuits to check the answers. 🙂

Ripple Tanks

In the past, I’ve used ripple tanks to get my students to develop the conceptual understanding of waves, and to see some of the key effects – reflection, hard-edge diffraction, etc. The modeling curriculum, however, uses ripple tanks to develop an intuition for Snell’s Law. So today we brought out our ripple tanks, set them up, and looked for a change in the direction of wave propagation when water surface waves pass to a new medium.

image

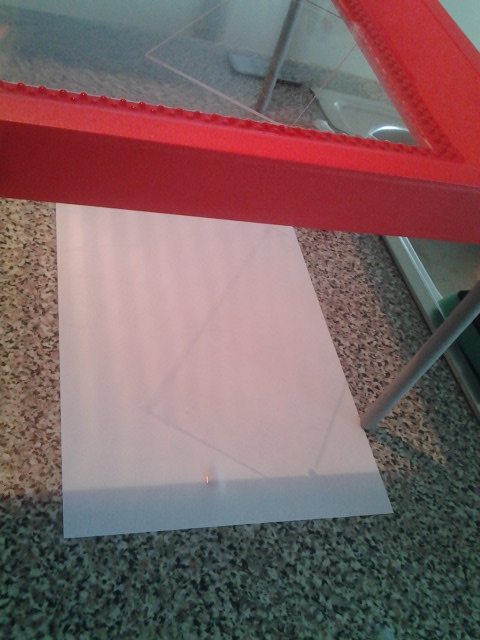
The next step is to use semi-circular acrylic disks to derive Snell’s Law, but I am not sure we have time for the full modeling cycle on this one. I think the students got a pretty good understanding of the effect today, so I think this topic will get IB brevity instead of Modeling depth. Here is my attempt to photograph the refraction effect.

image

It’s strange when you need to turn off the light and let the students discover things with apparatus in the dark. I coukdn’t keep an eye on everything, and ended up getting into some really deep series of Socratic questioning as I circulated. I suspect the dark lab meant decreased time on task, so perhaps I will need to come up with a better solution for our diffraction/interference patterns work later this week.

#modphys: Students or Friction?

We spent this week on the a=F/m paradigm lab. Once the students got their data whiteboarded, I began to see some problems — serious problems. The close relationships I had seen during my practice runs were nowhere to be seen: instead, the students had graphs dominated by systematic errors and an assortment of unorthodox, confusing ways to represent their data.

image

The picture above looks alright, except that the reciprocal of the slope (about 0.4 kg) is rather different from the 0.2 kg one would expect. Other groups clearly had trouble getting consistent data.

image

And others clearly haven’t bought in to the idea of the course.

image

In the evening, I replicated their experiments, and got results akin to the first graph. Today, I re-did the experiment with my hover disc, with only moderate improvement. It seems that the modified Atwood machine really needs a dynamics track to work. Drats. Maybe next year I will try to build an air track with a shop vac.

image

#modphys: Newton II

We finally began our Unbalanced Forces Particle Model today with, of course, a paradigm lab. The students brainstormed factors that might affect the acceleration of a cart in a modified Atwood machine (cart tied to a hanging rope), coming up with the mass of the cart and the tension in the string. Groups of two picked one of these independent variables and set to work.

We used Logger Pro to analyze video footage in order to find the acceleration, which I find works better than the motion detectors (in addition to being more conceptually relevant, and anyway, I only have one motion detector). The modeling materials suggest inclining the surface slightly to counteract the force of friction, but I rather disliked this idea: in my trial runs, I got good enough results with a flat table and our cheap plastic carts. We measured the masses on balances, and got the tension using the force law for gravity we discovered previously.

image

Probably the most difficult part was figuring out which range of masses and tensions to use, both as control and independent variable. I found that 10 to 70 g was about right for a hanging mass when the cart has a mass of 50 to 300 g. Smaller hanging masses and heavier cart masses in this range produced smaller accelerations, which were easier to measure. Smaller cart masses showed less friction.

We managed to collect the data and most groups began to compile it into a single graph. I asked everyone to be prepared to whiteboard their results at the start of class tomorrow. This should be a rich board circle, so I will try to encourage the students to take a more active role in the discussion.

#modphys 24/180: A €2 Dynamics Track

We have been working on the Constant Acceleration Particle Model over the past week. I introduced the topic using video analysis with LoggerPro, but unfortunately we haven’t been able to get convincing v/t graphs. I suspect a combination of clumsy fingers, air resistance, careless clicking, and LoggerPro’s obnoxious approach to derivatives (second order Newton-Raphson?). Combined with the need to prepare for a practical, it was time to go tangible for the deployment lab.

I really wish I had a proper dynamics system, but unfortunately the money just isn’t there. I spent a lot of time rolling carts, cylinders, and balls down ramps before I discovered that the Vernier motion detector works just fine inside a pipe.

image

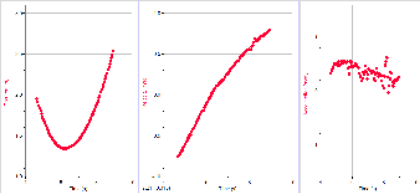
For some reason (perhaps a type of resonnance?) the face of the motion detector needs to be slightly off-center. But I was able to detect a marble within the pipe above to about the length of the 3 m pipe. The graphs from this motion are below. The a/t graph is pretty noisy, but I think I could convince myself of a constant value. The v/t graph is clear enough to show the effect of rolling friction.
image

I also tried one of my plastic cars in a larger pipe (formerly used for a perfume diffusion experiment, so it retains an aura of synthetic mystique). It seems to work well. The wheels roll only on their outer rims, which should help to reduce frictional effects and keep the car moving straight.

image

#modphys 18/180: Magnetic Field

I’ve been using the Electricity & Magnetism modeling materials with my grade 12 physics class, pulling out segments and re-arranging models to fit our fields-based approach. Today I introduced the magnetic field using the paradigm lab(s).

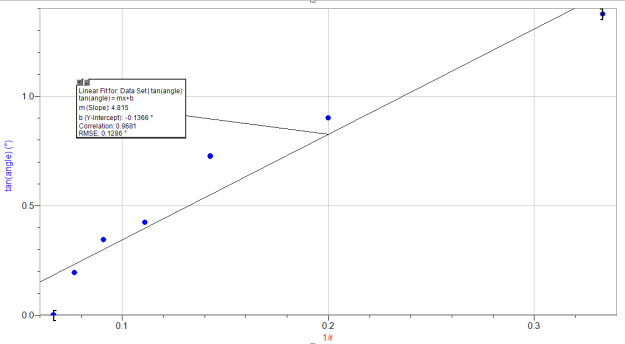
One conceptual difficulty we hit (not for the first time!) is the conceptual hurdle involved in using  quantity that is proportional to the quantity we are trying to measure. Here, we measured the angle between north and the direction a compass points near a current-carrying wire. Then, through a trigonometric argument, we used the tangent of that angle as a stand-in for the strength of the magnetic field caused by the wire at that point. Thus, our linearized graph eventually showed that tan(angle) is directly proportional to the inverse of the distance.

rihards_11sept_magnetism

I’m not sure there is a better way to do this paradigm lab, but we did play around a bit with ways to visualize the sum-of-two-magnetic-field-force-vectors.

image

We found a bag of tiny compasses, which seemed to work pretty well (although they sometimes needed a tap to remind them of their profession!). Here, they are aligned with no current flowing through the wire. I accidentally deleted my photo of the compasses with current flowing — I’ll try to recreate it next week.

image

I think next week we’ll work with the apparatus again, to try to eek out F=qvB (although, more usefully but I think less conceptually clear, we’ll probably have to aim for F=LiB).